I voted by mail at the end of October, after watching the candidates for governor debate on TV. That debate settled it for me. Then I sent my ballot in and waited, and I didn’t know how things turned out until the day after the election.
I don’t follow politics as closely as I used to. I still keep up with current events and what our political leaders are doing, but I care less than I once did. I vote, and I try to do my research.
That’s harder than it sounds. There’s so much negativity, so much attacking the other person or the other party, that accurate information is hard to find, and most of us are too busy to dig for it. I also don’t talk politics with certain friends and family. We see things differently, and even though we’re family and friends, it feels tense, so we don’t bring it up. I’ve felt disillusioned, and that feeling is why I wrote this piece, and why I’ve written other pieces about politics and political figures.
I live in Hennepin County. Next door is Ramsey County. Between them, those two counties cast about a third of the votes in Minnesota’s statewide races this year. I pulled the numbers from the Secretary of State’s results file, because I wanted to see it instead of just feeling it.
What the numbers show
Here’s how the five statewide races broke down. These are DFL and Republican votes only.
| Race | Hennepin + Ramsey (DFL / R) | Rest of the state (DFL / R) |
|---|---|---|
| U.S. Senate | 74% / 26% | 46% / 54% |
| Governor | 76% / 24% | 47% / 53% |
| Attorney General | 73% / 27% | 45% / 55% |
| Secretary of State | 76% / 24% | 48% / 52% |
| State Auditor | 74% / 26% | 45% / 55% |

What jumps out at me is how consistent the difference is. Hennepin and Ramsey voted about three to one for the DFL candidates in these races. Outside those two counties, the races were much closer, but the Republican candidates came out ahead. That contrast doesn’t tell us what any individual voter believes. It does help explain why people looking at the same election from different parts of Minnesota might see a very different picture.
In the Senate race, for example, Hennepin and Ramsey together cast about 663,000 DFL votes and 230,000 Republican votes, a margin of roughly 434,000 for the DFL. Every other county, added together, went about 1,004,000 Republican to 857,000 DFL, a Republican margin of roughly 146,000. Statewide, the DFL won that race by about 287,000. In other words, the metro margin outweighed the rest of the state combined.

A note on these numbers: They come from the Minnesota Secretary of State’s unofficial results file (see Sources below), which showed all 4,105 precincts reporting. I downloaded it on Wednesday, November 4, 2026, and I haven’t rechecked it since. Results are unofficial until certified, so figures could change slightly. The percentages count only DFL and Republican votes, so they won’t match news totals that include third-party and write-in candidates. “Rest of the state” means every county except Hennepin and Ramsey.
What the county maps show
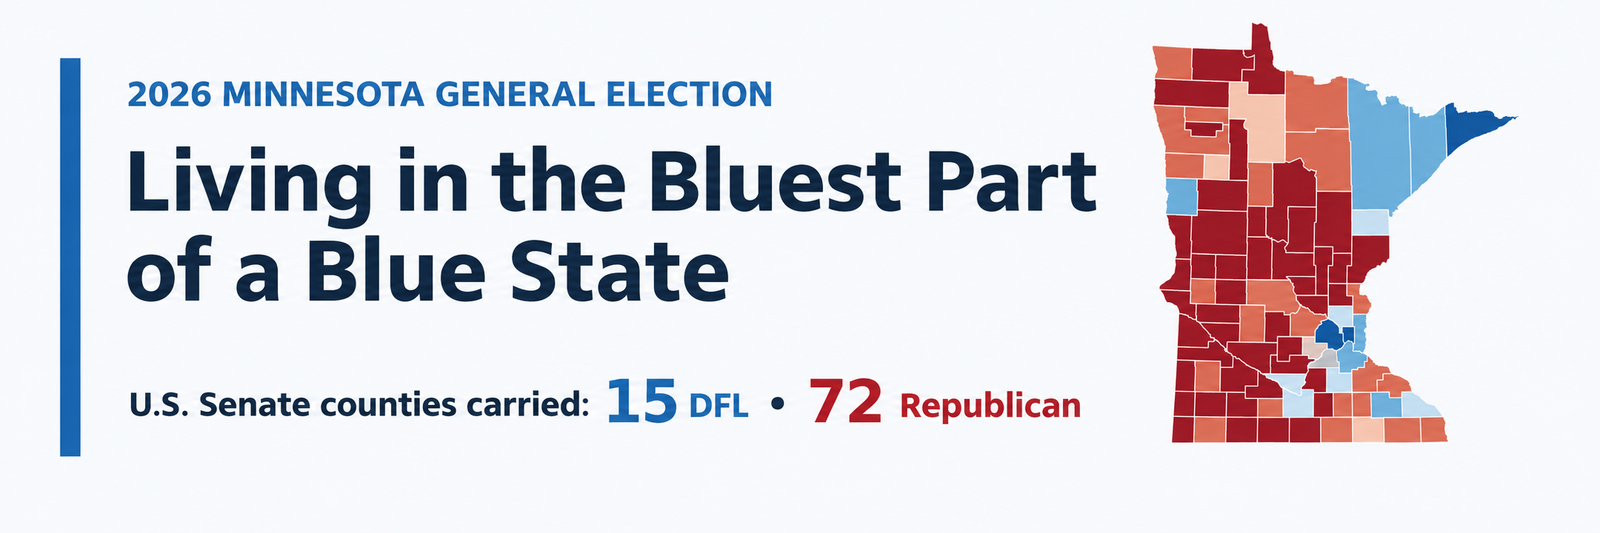
I also wanted to see how the votes were spread across all 87 counties. The maps are striking. In the U.S. Senate race, the DFL candidate carried 15 counties and the Republican candidate carried 72. The attorney general and state auditor races had that same county count. In the governor and secretary of state races, the DFL carried 17 counties and the Republican carried 70.

That may look odd at first: how can a party carry far fewer counties and still win statewide? But counties have very different populations. Each voter has the same weight in a statewide election; each county does not. A map shows where the votes were concentrated geographically, not how many people live in every colored area.
What about Duluth and Rochester?
Outside the Twin Cities area, the two biggest cities in Minnesota are Rochester, home of the Mayo Clinic, with about 122,000 people, and Duluth, home of the University of Minnesota Duluth, with about 87,000. I wanted to see whether they voted like the metro, so I looked at the counties they sit in. In the Senate race, St. Louis County (Duluth) went about 62 to 38 DFL, and Olmsted County (Rochester) went about 60 to 40. That’s well to the left of the rest of the state, but well short of the three-to-one margin in Hennepin and Ramsey. Keep in mind those county numbers include everything in each county, not just the cities.

Population figures are 2024 Census Bureau estimates (American Community Survey). See Sources below.
What I hear from people outside the metro
I’ve talked to people in rural Minnesota, and a lot of them tell me they don’t feel heard. Many rural areas here, and across the country, have voted Republican election after election. I’m not saying that’s right or wrong, and I’m definitely not saying those voters are bad people. What I keep hearing is that they don’t feel the Democratic Party is the party of people like them anymore.
It’s also discouraging when you cast your vote and feel like it can’t move the result, because the biggest counties outnumber you so heavily. The math says every vote counts the same. But when two counties cast about a third of the ballots, I understand why it can feel otherwise.
“Rest of the state” isn’t the same as rural Minnesota. It includes Duluth, Rochester, and the suburbs. It also includes plenty of voters in small towns who went the other way, since nearly half of the vote outside Hennepin and Ramsey went to the DFL candidate in these races. So I don’t want to paint everyone outside the metro with one brush. But the gap is real, and I think it’s worth taking seriously.
I plotted the county results another way, too. Each dot below stands for one county, arranged by its DFL vote share. There is a lot of variation that gets lost when we talk about “the rest of the state” as though it were a single place. And because one dot represents a county regardless of how many people live there, these charts show a geographic pattern, not a population-weighted one.

Where I’m coming from
I grew up in a small town in Minnesota, and I live in the middle of the Twin Cities now. I’ve voted for candidates from different parties in different elections, and I don’t feel tied to one label. In 2024 I wrote a piece called Left Behind by the Democrats about how small towns can feel overlooked. That’s still on my mind, but I’m looking at it more calmly now.
What I’m not saying
I’m not saying a vote in Hennepin County counts for more than a vote anywhere else. In a statewide race, every vote counts the same. That’s the strongest argument for the system we have, and I take it seriously.
What I wonder about is attention. When a third of the vote lives in two counties, and the result is lopsided there, what does a campaign do with its time? Where does it show up? Whose problems get named out loud? I don’t have an answer yet. I do think it’s fair to ask whether people outside the metro feel heard, and whether people inside it, in races that feel decided in advance, feel like their vote matters.
What I’d like to hear
I’d rather have a real conversation than an argument. If you disagree, tell me why. Wherever you live, do you feel like your vote matters differently because of it?
About the graphics and data
I used AI to help create the maps and charts in this article. The underlying election data was downloaded directly from the Minnesota Secretary of State’s website, using the unofficial results from the November 3, 2026, general election. AI helped with processing and visualizing the numbers, but it was not the source of the election results.
The graphics are intended to make the differences between Minnesota’s counties easier to see and understand. The percentages shown use DFL and Republican votes only, unless otherwise noted. Readers who want to examine the original numbers can find the official data file linked below.
Sources
- Minnesota Secretary of State. (2026, November 3). 2026 General Election results by county (unofficial data file). Retrieved Wednesday, November 4, 2026, from https://electionresultsfiles.sos.mn.gov/20261103/allracesbycounty.txt
- U.S. Census Bureau. (2024). 2024 American Community Survey, Minnesota demographics by city (compiled by Cubit Planning; last updated February 9, 2026). Retrieved November 4, 2026, from https://www.cubitplanning.com/citations/demographicsby-v2026.html
- Wheels On Down the Road. (2025). Left Behind by the Democrats (written November 7, 2024). https://wheelsondown.com/left-behind-by-democrats/
All percentages, vote totals, and margins are based on the Minnesota Secretary of State’s county-level election results, with AI assistance in analyzing and presenting the data.They include DFL and Republican votes only.
Leave a Reply